Monday, September 16, 2024

Turning Defensive

Things changed dramatically in July.  While you hear a lot of talk of a soft landing and limited economic weakness, the price action in the stock market tells otherwise.  Maybe there is something to this economic slowdown that is being underestimated by investors, as they remain heavily invested in stocks. 

The SPX is back to mid July levels above 5600, but underneath the surface, investors have been moving from offensive sectors to defensive sectors.  This can be measured by the performance of low beta, defensive sectors such as consumer staples (XLP) and health care (XLV) vs. the Nasdaq 100, filled with high beta tech stocks.  During the past 3 months, the QQQ is flat but the XLP is up over 10% and XLV is up over 7%. 

This coincides with the AI peak that we saw in late June/early July, when NVDA went over $140.  Looking back, it is becoming more and more clear that the AI hype reached its peak this summer, and will unlikely reach that same level of mania even if the SPX goes to new all time highs later this year.  

This sector rotation, with many defensive stocks reaching 52 week highs, and many economically sensitive stocks reaching 52 week lows, as the SPX trades above the 50 day moving average, has fired off a few Hindenburg Omen signals last week.  A cluster of signals gives a strong warning of a looming correction.  A lot of people ridicule this indicator, but it has a much better than random track record of identifying short term market tops.  The last signal was in mid July, correctly warning of an impending selloff.  


Getting more and more 2000 vibes as this year plays out.  In early 2000, semiconductors were the hottest sector, even hotter than internet stocks.  We reached a similar level of semiconductor/AI mania this past summer.  Here is a chart of the SPX and Nasdaq Composite in 2000.  While the Nasdaq topped out in March 2000, the SPX lingered close to the highs for a few months until September 2000, before both indices went down in a vicious bear market in the final quarter of the year.  

Year 2000 SPX vs Nasdaq

Similar to 2000, you have very high allocations to equities as a percentage of total assets.  We are at late 2021 levels of equity allocations as of the end of June.  Even at the peak in 2000, you never got to these nosebleed equity allocations, and that's when everyone was talking about stocks.  Stocks are almost viewed as a no-brainer investment over bonds over the long run.  Of course, that's with average valuations, not coming from a point when stock valuations are around the highest in its history. 

Let's not forget about aging demographics in the developed world.  The baby boomers hold a huge chunk of the equities owned by households, and their current age range (born 1946 to 1964) is from 60 to 78.  The developed world was much younger in 2000.  Now you will have baby boomers disposing of equities due to either death (inheritance taxes/spending inheritance will lead to stock sales), elder care/nursing homes (selling stocks for cash), allocation shifts from stocks to bonds to reduce risk, etc.  

On the economy, this is just my 15 minute macro take, so not to be taken too seriously.  But could it be that the lack of money supply growth since 2022 is finally having an effect on the economy? No one talks about the money supply anymore, but it hasn't grown at a rate that's consistent with a strong economy.  Of course, a lot of that is payback from the crazy jump higher in 2022 in 2020 and 2021, but inflation already reflects that jump higher in M2.  So low money supply growth in a slowing economy with less fiscal impulse should result in a weaker economy.  M2 money supply grew 5-6% from 2010 to 2019, and growth was slow during that time period.  

And the distribution of the money is different now than it was before 2020.  Sure the pie is bigger with all the money printed, but the percentage distribution is even more skewed towards the wealthy, who have more money than they know what to do with.  The wealth inequality continues to expand.  Corporations and the wealthy have so much political power with all the money they spend on lobbying and donations, they shape regulations and tax rules that favor further wealth accumulation.  In the end, unbridled crony capitalism ends up with something that you see in a place like Russia, where a small group of government officials and oligarchs hold all the country's wealth, and the rest of the population are basically wage slaves. 

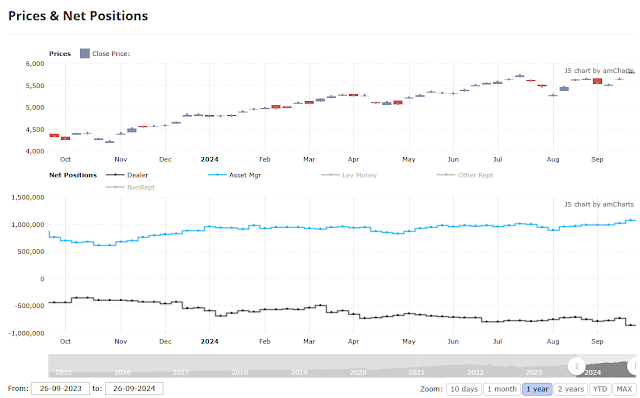
The Commitments of Traders data for SPX futures continues to show asset managers remain near all time highs in net long positioning, as they hardly budged during the selloff in the first week of September.  As a percentage of open interest, in the third quarter of 2024, asset managers have never had greater net long positioning in its history.  Mainly due to a reduction of short positions.  Fund managers are extremely lightly hedged.  Along with the SPY and QQQ short interest data that I wrote about in July, you have all the ingredients for the start of a long bear market. 

On Friday, you finally saw call buying come back, with the total put/call ratio falling to 0.68.  Also seeing signs of Twitter traders re-embrace the bull side, and wanting to be positioned bullishly ahead of the Fed's first rate cut of this cycle on Wednesday.  Given that quarterly opex is this Friday, and with election uncertainty about to come on stage, I expect a bearish post opex week.  The Street will want to re-add put hedges that come off on the Friday expiration, and/or sell stocks to get back to lower net long positioning.  Investors will not have much tolerance for market weakness due to how lightly hedged they are.  You got a preview of that in the first week of September, when the SPX fell 240 points over 4 trading days.  

In the bond market, you continue to see strength, and the bullishness is palpable.  Its almost taken as fact that bonds will rally when the Fed cuts rates.  That may be true for short term T-notes, but definitely not true for long bonds.  The monster budget deficit will need to be funded with lots of bond issuance.  The 1982 to 2020 bond bull market was fueled by labor arbitrage to China, reducing manufacturing costs, faster CPUs leading to rapid productivity growth, growing globalization increasing free trade, and gradually decreasing budget deficits as a percentage of GDP for much of that time period.  You have the opposite now, with budget deficits exploding higher, as well as an aging demographic, reducing the working age population / total population ratio, which contributes to higher services inflation.  

In the short term, bonds will face headwinds due to election uncertainty and the potential for more tax cuts and/or fiscal stimulus.  Both candidates are free spenders and could care less about controlling fiscal deficits.  Populism is inflationary, and politics worldwide (except China) has never been more populist than now. 

Did not expect that the market would give me another chance to short around the August highs but here we are.  Admittedly, I was a bit too eager to start shorting, jumping the gun by shorting last Thursday, before the SPX squeezed higher later in the day and on Friday.  One could argue that weak markets don't give you a lot of time to short the highs.  That is usually true, but markets that are transitioning from a bull market to a bear market exhibit some bull market tendencies while the market tops out.  It appears that we are in that transition phase as the stock market goes from bull market to bear market.  This is based on investor positioning data, equity valuations, and price action.  

Could the market get even bubblier and make a blowoff top (SPX 6000+) into year end? Its possible, but I would give it less than 25% odds.  And even if it were to do so, I would expect most of that blowoff move to happen in November, when I would loathe being short.  In fact, I would actually welcome a blowoff top, even though its unlikely to happen.  

I see too many viewing the Fed as a backstop to support this weakening economy despite monetary policy losing a lot of its potency.  When you take away the refinancing option for the vast majority of home owners who are on very low fixed rates, that reduces a lot of the monetary stimulus provided by lower rates.  Same goes for corporations, many who are locked in at lower rates, and will be re-issuing at higher rates even with Fed rate cuts, since bond yields now are much higher than 5 and 10 years ago.

Fed rate cuts reduce interest income, a big source of cash going straight from the Treasury to households.  When you have such a huge US national debt, oddly enough, interest rate cuts can actually reduce income for a substantial portion of the population, as well as for banks.  Remember, the US Treasury funds interest payouts not by reducing spending, or increasing taxes, but by issuing more Treasuries.  So reducing interest payments with a lower Fed funds rate is actually a fiscal contraction, not an expansion for the government. 

Will the Fed go 25 bps or 50 bps at the upcoming meeting?  Based on the leak from Nick of WSJ on Thursday, Powell is itching to cut 50 bps to pump up the stock market, to increase the chances of Trump losing.  He can force his way to cut 50 bps with dissents and that will reduce the power of his pump attempt, and look bad, but he also doesn't seem to have full support for 50 bps among the committee because it looks so blatantly political.  Powell wants to get 50 bps with no dissents, having his cake and eating it too, but not so sure the rest of the committee will agree to let him have his way with inflation not slowing down fast enough and with economic data that doesn't warrant a 50 bps cut at this point.  

Either way, 25 bps or 50 bps, it will be forgotten by Friday, and it will be on to more pressing issues, such as the upcoming election as well as the newly feared data release of the month, nonfarm payrolls.  

Looking to add to shorts today or tomorrow, to play for a correction over the next few weeks.  Seasonal weakness coincides with corporate buyback blackout period starting this week, and the big triple witching options expiration this Friday.  Add the November election to the mix.  Its looking like a coin toss according to election betting markets and the uncertainty will likely lead to some volatility soon. 

Monday, September 9, 2024

Missing Opportunities

Last week was a classic example of the downside of waiting for the exquisite opportunity.  The opportunity can just pass you by.  The bus can leave the station before you expected.  There are no guarantees in the market, unexpected things happen, which is what keeps people coming back to the biggest casino in the world.  If the casino always won, the players would never come back.  But the players sometimes win, which is what keeps them coming back.  Unexpected things happening in the market = players winning in the casino.  They happen much less than 50% of the time, but they happen often enough that the gamblers and speculators keep coming back to play.   In the long run, the casino wins.  But in the short run, the players sometimes have their moment in the sun, basking in their wins.  

Its not often that you see a feared event, the nonfarm payrolls report last Friday, in a bull market, actually deliver on the fear and scare investors enough to force them to sell heavily both before and after the event.  That's what you saw last week, and its not common.  Quite a few unusual things have happened in the past few weeks, which makes the market trickier than usual.  

You first had a V bottom off the August 5th low, even though the market was in a seasonally weak time of year, and was super overextended in July before dropping into early August.  Usually such overextended positioning and excessive bullishness gets worked off by the market trading in a choppy, lower range, not a V bottom off a mini panic low, that takes it quickly towards the previous highs.  The market managed to both squeeze the early short sellers and also crush the late long buyers in the past 3 weeks.  Its been an uncomfortable market for both the bulls and the bears.  

You are hearing a lot of talk about September being a seasonally weak time of year for the stock market, while its selling off.  While I agree with the crowd about September likely to be weak, you have a late quarterly options expiration this month, with opex on September 20.  So there are still 2 weeks left till the big expiration.  Still plenty of time to reverse the current down move.   In bull markets, stocks usually don't sell off hard before triple witching opex (quarterly opex).  The pattern is one of strength up to middle of quarterly opex week, and then weakness starting from opex day extending to post opex week.  The reason for this pattern is because many of the longer term options hedging is done in the quarterly expirations, which have the most liqudity and biggest open interest.  Thus, you get a build up of a lot of put hedges that provide downside protection for investors until opex, at which point investors are again more lightly hedged and more likely to sell stocks/buy puts instead of just holding on to their positions.  

The downside put protection is still there, and there are still almost 2 weeks till expiration, so there is definitely room for stocks to bounce in the pre-opex window.  But as you get closer to that quarterly opex, the less support there will be.  The FOMC meeting is on September 18, so I don't expect a huge down move before that event, especially with opex still to come after the Fed.  So there is a window of about a week where we can see a countertrend bounce, which would be a good opportunity to short SPX.  

Bigger picture, beyond September, the positioning is looking unfavorable for longs.  The COT data as of September 4, which covers the period when SPX went down approximately 100 points, the asset managers went nowhere, and held their heavily net long exposure.  On the other hand, leveraged funds covered a big chunk of their short position.  While asset managers are the best fades in the COT data, the leveraged funds are also a bit of a fade, as they are usually the least short before a long downtrend begins (e.g. Dec. 2021).  Dealers also added to shorts into a down tape, which is a bearish signal.  Overall, its looking grim for the bulls for the next few weeks. 


The options data was mixed last week, you did see a pick up in put buying and the put/call ratio, but the levels are not extreme, and nothing that would signal a significant bottom.  This supports the view that any bounce should be minor, and that there is further to go in the selloff that started last Tuesday.  By the time we reach a low for this selloff, probably sometime in late September/early October, the bearishness will likely exceed that of early August, and it will likely be a sloppy bottom, more like a U than a V.  

The continued underperformance of the Nasdaq 100 vs the SPX is an ominous sign for the long term prospects for this bull market.  Bull markets feed off of an increase in risk appetite, a desire for high beta equities, not a search for low beta equity exposure.  Since the October 2022 bottom, up until the July 2024 top, the Nasdaq 100 was the leader, outperforming the SPX throughout.  Due to both superior earnings growth and AI hype.  That has changed dramatically over the past 2 months.  The current Nasdaq 100 underperformance is similar to what you witnessed in the latter parts of 2021 and first half of 2022.  That was a bad time to be long equities.  

While the economic situation is quite different now than in late 2021, one thing is similar.  The sky high household asset allocation to equities vs other asset classes.  That is one of the single best predictors of long term equity returns.  Compared to 2021, the earnings outlook is poorer now due to the lack of money supply growth vs 3 years ago, as well as the nearing maturity wall of corporate debt coming due in 2025 and 2026.  The average yield on corporate debt outstanding is much higher now than in 2021, while the money supply growth is slower.  Fiscal deficits are also lower as a percentage of GDP now than vs 3 years ago.  This is mainly due to the absense of some of the Covid stimulus, which is the gift that keeps giving, but at a slower rate now than before. 

Overall, this is a more bearish long term set up than late 2021.  Not only will earnings growth be slower over the next 3 years than from 2022 to 2024, the baby boomer population will be shrinking leading to net selling of stocks from that demographic.  2025 will be quite the contrast from 2023 and 2024.  It may be a bit of a shock to those with short memories and a permabull mentality.  

We are getting a big gap up off the "scary" selloff on Friday, that gave investors flashbacks to August 2, and the possibility of a manic panic Monday post NFP.  Alas, that selling was front run by risk management teams at the funds and it appears that the first wave of this selloff is finished.  I expect more waves of selling to continue in the weeks ahead but the pre quarterly opex forces should be supportive this week.  Any bounces above 5500 up to 5550 will be good spots to put on short positions.  Waiting for the opportunity. 

Tuesday, September 3, 2024

On the Battlefield

There are various weapons used on the battlefield.  Same applies for the markets.  There are times where leverage is useful, and times when its too risky.  You can divide it into 3 main types:  cash instruments (stocks, bonds), futures, and options.  There is a time and place for each type.  In general, the higher the conviction on future price movements, the more leverage one should utilize.  Leverage is a double edge sword.  It amplifies volatility, which is a negative more often than a positive.  Excess volatilty without a big edge is a long term drag on returns.  

Let’s get down to the main reason why people use leverage.  Its to get rich quick.  On Reddit, you usually see traders post their P&L after big wins.  Sometimes after small wins.  But rarely after losses, big or small.  So what people see on social media is a distorted view of trading.  You see traders post a lot of big wins, some small wins, and very few losses.   Big wins are glorified.  Losses are not mentioned and ignored.   Other traders see this, get FOMO, try to replicate those big wins by betting bigger through leverage.  The most popular form these days is to be long shorter dated options that have low premiums but lots of gamma.  Of course, there is a steep price for that gamma.  Its in extremely fast theta burn, or time decay.  Dramatically lowering the odds of winning.

Its hard enough to pick the right direction.  With options, you add another layer of difficulty by trying to predict when that move happens.  The shorter the expiration, the smaller the time window you have for that move to happen.  If the moves doesn’t happen before expiry, your option ends up worthless.  A 100% loss on investment.  If you go all in on options, you only need to be wrong once to be wiped out.  Even if you don’t go all in, just going in more than 20% with each option trade will eventually whittle down your account to dust.  

It seems obvious, but avoiding big losses is the number one priority as a speculator.  Everything else is a distant second.  You cannot treat all losses the same.  But a lot of traders do.  Traders hate losses.  That’s just evolutionary conditioning.  A small loss of 2% that happens ten times in a row will be way more tilting and annoying than one 30% loss, but you have to take those small losses even if they make you feel bad.  You don’t necessarily take small losses because you are wrong.  You take small losses to prevent them from becoming big losses.  

The best way to give your trades room to work (wider stops) and still have small losses is to trade small.  But most people who are attracted to trading are not interested in grinding it out by playing small ball.  And I don’t mean small ball in the form of daytrading for small wins to try to make money every day.  I mean trading longer time frames with smaller size to keep losses small, to reduce the volatility of your account balance.  That is what’s necessary for long term winning.  Not slinging huge size for quick, big scores.  

Let’s compare trading to war.  As there are various weapons of war, there are various ways to express a trade.  

Here is a list from least leverage to most leverage:  

Cash instruments (stocks, bonds, commodities)

Futures

Options (Shorter expiration = more leverage)


Here is a list from least risky to most risky: 

Cash

Treasuries (longer maturity = more risky)

Corporate Bonds

Stocks and Commodities


Cash = ammo, unloaded guns, unloaded missile systems

Bonds = defensive instruments: anti missile system, mines

Stocks = machine guns, grenades, bazookas

Futures = artillery, drones, glide bombs

Options = bunker buster bombs, tactical nukes

I see too many traders trade options like its a machine gun rather than the big bombs/tactical nukes that they are.  Options markets have the widest bid ask spread and most slippage of the major trading instruments.  They are costly to trade.  They are more appropriate for high probability special situations and intermediate term trades that last from 1-4 weeks.  They are not appropriate for day trades or even swing trades.  But I see way more traders use options for quick trades than longer term moves.

Futures and stocks are more similar except for the leverage available.  Futures give you more firepower if you want to use it.  Futures are the most liquid and flexible trading products out there.  Futures have much less slippage and lower trading costs than options.  So those wanting to day trade or play for short term moves are better off trading futures than options.  In most cases, futures are the best way to express a trading view.  

Within the options space, there are various strategies that range from low risk to super high risk.  Contrary to what they say, shorting options is not riskier than being long options.  Given the much higher margin requirements for shorting options, you just won’t be able to put on nearly the same size as you can being long options.  That’s why most retail traders trade options from the long side, because of the much higher leverage and size they can put on.  Its the lotto mentality.  You can only make as much as the premium you  sell when you short options.  But being long options, you pay the premium to have much greater potential upside.  Like a lotto ticket.  But just like lotto tickets, the odds are almost always against you.  

Not all options trading is negative EV, but the most popular ways of trading options are negative EV.  Most retail options speculators are not putting on spread positions.  They are putting on naked long options positions playing for a quick up or down move.

There are options spreads which mitigate some of the negative EV of just being long options, like put or call spreads, calendar spreads, etc.  In most cases, its better to be long put spreads than long puts.  The same cannot be said for call spreads because OTM calls are usually underpriced, while OTM puts are usually overpriced.  The reason is that investors like to sell covered calls (selling OTM calls against underlying position) and buy puts (hedge against market downside), regardless of price.  

Bottom line, in most cases, buying options is like being the player at the casino.   Selling options is like being the dealer at the casino.  But there are special cases and exceptions where options are too cheap, but its usually not short dated options, but longer dated options that are underestimating long term volatility.  

Back to the current markets.  Last week was uneventful, with sideways chop.  The big event was NVDA, and it ended up being a bit of a dud, not what bulls were looking for, as most of the weekly calls evaporated into nothing.  And it wasn't much of a winner for bears, as the stock only went down a few percent, less than the implied vol of the ATM puts.  So most of the put buyers also lost money trying to play for downside on NVDA earnings.  The only real winners in the options trades last week were the market makers who made out like bandits, with NVDA calls and puts both losing a lot of their value post earnings.  

The COT report released on Friday showed a continuation of the trend of asset managers adding to net longs.  This time, small speculators added a lot to their already sizeable net long positions, bring them back up to near their highest levels of the year.  

The systematic traders also were likely adding long exposure as the vol control funds will have slowly been adding to stocks as volatility dies down, and the 30 day look back period replaces volatile late July moves with much less volatile late August moves.  The CTA fund that I track has also added a bit to their S&P 500 longs last week.  

In the options market, I continue to see more complacency with low put/call ratios and less put hedging.  The options players are not leaning as bullish as they did in early/mid July, but still quite bullish overall.  

Got short bonds on Friday for a short term trade.  With SPX back near all time highs and recent economic reports coming in better than expectations, there is a window for weakness for the bond market.  The price action also looks heavy considering the weakness after a very dovish Powell at Jackson Hole, and a run of the mill GDP report last Thursday.  Also, leveraged funds massively covered shorts from August 20 to 27, which should alleviate a lot of potential buying pressure from fast money players. Not looking for anything big, just a pullback after an extended up move over the past 4 months. 

For the stock indices, it takes time for the trauma from a sharp down move and big VIX spike to fade away.  As August 5 goes further into the rearview without any big moves, investors feel more emboldened and confident in the continuation of the bull market.  That sets up an opportunity heading into a seasonally weak time period of the year, mid September to mid October.  

Just from looking at the price action last week, while the market was basically flat from the start to close of the week, you had quite a bit of intraday volatility.  This tells me that there is not a huge underlying bid to this market, as the first sign of a lack of a steady bid is higher intraday vol.  HFTs are very adept at sensing big buyers and big sellers laying in the weeds.  If they sense that there are no big buyers, they will not provide much liquidity, and you will see quick dumps of 20-30 SPX points on little volume.  That happened quite a few times last week despite SPX going nowhere.  A sign of weakness underneath the surface. 

There seems to just be one more hurdle left for the bulls to clear before they regain full confidence in this unstoppable bull market.  That is the nonfarm payrolls report on Friday, September 6.  I expect latecomer bulls to buy after the report, good or bad, as there is still some lingering fear about economic weakness.  Once that uncertainty clears, and if we are at all time highs, that could be the time to put on shorts.  Need to see how this week plays out and how the market trades going into and out of that report.  The more intraday volatility, the better the signal will be to fade a rally.