Monday, July 22, 2024

Sitting Tight

This game is 90% psychology.  You can read all the trading books, filled with cliches like "cut your losers" and "ride your winners", and it won't help you at all unless you can control your lizard brain.  We are all just animals that evolved to be good at survival and reproduction, nothing more, nothing less.  We didn't evolve over the millennia to be good at trading.  Being good at trading is not natural.  We evolved to hate losing, because that lowered our odds of reproduction and survival.  But that hatred of losing is what causes us to hold our losing trades longer than our winning trades.  Taking losses is admitting to being wrong and accepting defeat, things that didn't help with the goal of human survival and reproduction over the past 100,000 years. 

In the 1970s and 1980s, before the proliferation of technical analysis based trading and trend following systems, trend following was a simple, but very profitable trading strategy.  Trends would last a long time because so many traders were reluctant to take losses when losing and were quick to take profits when winning.  Trend following doesn't work so well anymore because there are so many trend following CTAs and hedge funds that follow systems that ride the momentum.  With so many more speculators trend following, it has created more false breakouts and trends that die out more quickly.  

Trend following still works, but it works better now in shorter time frames, rather than in longer time frames as in the past.  One of the things I've noticed in the SPX is how often you have trend days, but that most of the move is finished by lunch time, rather than by the close.  Systematic and HFT traders have become so quick to recognize and catch the trend that an up move that would normally be spread out over the whole trading day is instead compressed into the first 90 minutes.  The same goes for a down move.  This is valuable information for those who are looking to optimize their entries and exits during the day.  If you are going to short when the market is near the highs of the day, rather than shorting at 10:30 AM ET, its better to let the up trend go a bit more and short at 11:30 AM ET.  Or since you don't see too many intraday trend reversals, if it looks like a trend day by 10:30 AM, its probably best to just short in the final 30 minutes of the trading day.  

Overall, the market has gotten more efficient for shorter time frames, so its hard to generate alpha fading the intraday trends.  Its why I've gone from daytrading almost everyday to daytrading maybe once or twice a month.   In the HFT/hedge fund dominated short term trading world, retail traders are bring knives to a gun fight.  Trying to eek out gains through short term trading is exhausting and inefficient.  You are battling better capitalized, better informed traders on the other side.  Its a hard way to make an easy living.  

Back to the market.   The price action and news flow before Wednesday presented the setup.  One can either choose to wait for some price confirmation before entering shorts or to try to pick the highest price possible by selling strength.  There are pros and cons to both strategies.  I prefer trying to pick tops because it reduces the risk of getting whipsawed by short term movements.  But it increases the risk of being early on the short.  There are tradeoffs for both methods.  Its not easy trading the short side during a raging bull market.  But it can be done if you are picky with setups and only shorting when many things are lining up in your favor.  

As I mentioned last week, I thought the coming selloff would be just as steep as the rally was in the first half of July.  That's why I didn't want to wait for confirmation of weakness to short, because it would be hard to chase the weakness to put on a short position.  We've sold off 162 points in SPX over the past 3 trading days.  That's nearly 3% in 3 days.  It has taken the VIX from 13.19 to 16.52 during that time.  Its a fairly emphatic move coming off the high volatility, euphoric (for small caps) trading action that we saw early last week.  All you heard was how bullish it is for the market with Trump's election odds going higher.  People were talking about Trump trades and the strong breadth in the market with the Russell 2000 squeezing higher.  People forget how small and illiquid the Russell 2000 index is.  The market cap of the whole Russell 2000 index is less than the market cap of NVDA.  It can be jammed and moved easily with a few billion in ETF flows, which is what you saw over the past week.  

The weakness last week in the face of all the good news that came out is a good sign for shorts.  It points to a high probability that we reached bull saturation and upside exhaustion.  Add to that the seasonal patterns turning negative from post July opex into early October.  Plus the addition of election uncertainty, which keeps implied vol elevated, which increases the deltas of out of the money puts.  The market hates uncertainty, and that will help to keep a lid on any rallies from here till October.

Market participants have remained complacent and have been ignoring the selloff, hardly reducing their call buying, and there hasn't been as much put buying as one would expect with the SPX down 162 points in 3 days.  The ISEE call/put index has only slightly dipped, unlike the selloff in April, when it dropped big, and stayed down there for several days.  

The OCC put/call opening transactions data confirms the ISEE index readings.  The level of put buying barely increased, and the level of call buying barely decreased.  This is unlike what you saw during the April selloff, when the call buying decreased quickly, and the put buying increased quickly.  

The COT data now shows that asset managers are now the most net long SPX futures since early 2020, making them longer than they were at anytime during the bubbly 2021 market.  This is happening despite the steady decrease in open interest in SPX futures since 2020.  Micro E-mini SPX futures showed small speculators getting heavily long from July 9 to July 16.  


Anecdotally, the complacency is much greater now than in April.  One of the reasons I didn't get short in early April was because there wasn't that much euphoria or enthusiasm despite the strong uptrend.  In April, there was still a wall of worry about inflation and bond yields.  This time is much different.  People are bullish with the cooler CPI readings and the softer, but not too soft economic data, increasing the calls for a soft landing with the market now expecting, and very likely to get the first rate cut in September.  Early last week, there was lots of  bullishness and enthusiasm for this market, just from listening to the experts on CNBC and Bloomberg.  

News has come out that Biden has dropped out and endorsed Kamala Harris.  Politics is overrated, as both Democrats and Republicans have budget busting fiscal policies, so there isn't as much difference there as the pundits make it out to be.  Harris is a very weak and unpopular candidate.  First, all else equal, women politicians are less popular than male politicians.  Same goes for black politicians vs white politicians.  Obama was an exception, not the rule.  Second, Harris has already shown her weakness in the 2020 Democratic primary, being less popular than Biden, Sanders, Warren, and even Buttigieg.  

With this decision by Biden and the Democrats to pick Harris, it has handed Trump the win in November.  If the Democrats picked a moderate like a Joe Manchin as the candidate, it would be an almost automatic victory vs Trump.  Even RFK Jr. would be an almost automatic victory vs Trump if he was the Democrat nominee.  There would be many anti-Trump Republicans that would vote for a Manchin or RFK Jr. over Trump.  Almost none would vote for Harris over Trump.  Not to mention independent voters who would overwhelmingly prefer a Manchin/RFK Jr. vs a Trump.  But that will never happen.  Despite my view that Harris is almost a lock to lose vs. Trump, the betting markets won't feel that way, and that's what the financial markets will be pricing off of.  No amount of donor money coming into Harris will help her.  Luckily for the Democrats, her political career will end with this election.  The uncertainty of the election will linger, as many will overrate the chances of Kamala Harris vs Trump.  And there is a Democrat convention coming up in mid August, which I'm sure many fast money traders will be reluctant to be long into.

Initial price target for this pullback was SPX 5450-5470, but it may have been too conservative.  Given how traders have reacted to the 3 day selloff, its added to my conviction that we're going to get a significant selloff.  I now think that my final price target of 5360-5380 was too high, and that 5250 is now a reasonable price target for early to mid August.  I will be more patient with my short covers and more willing to re-short on any bounces for the remainder of July. 

Monday, July 15, 2024

Seismic Waves

Last week definitely shook up the system.  On Thursday and Friday, it appears that all the podshops decided to suddenly unwind their long NDX, short RUT trade.  With last week's Russell 2000 outperformance, you have a bunch of market "experts" who are suddenly bulled up because small cap stocks have outperformed large caps for the past 2 trading days.  CNBC was about as bullish as I've heard from them in recent memory, as they were touting the suddenly strong breadth in the market.  Seeing the strong outperformance of heavily shorted stocks last week, it looks more like a de-grossing of hedge fund positions than a new trend of high demand for small caps.  

You will often see these violent moves up and down at inflection points, where eager buying is met with eager selling.  This is not only happening at the index level, but at the spread level between indexes, as uncle points get reached and stop losses get hit.  These are classic signs of an imminent trend reversal.  You can feel the tension as the FOMO fast money gets hot and heavy, being met with supply from corporate insiders and longer term players gladly selling into these  high price levels. 

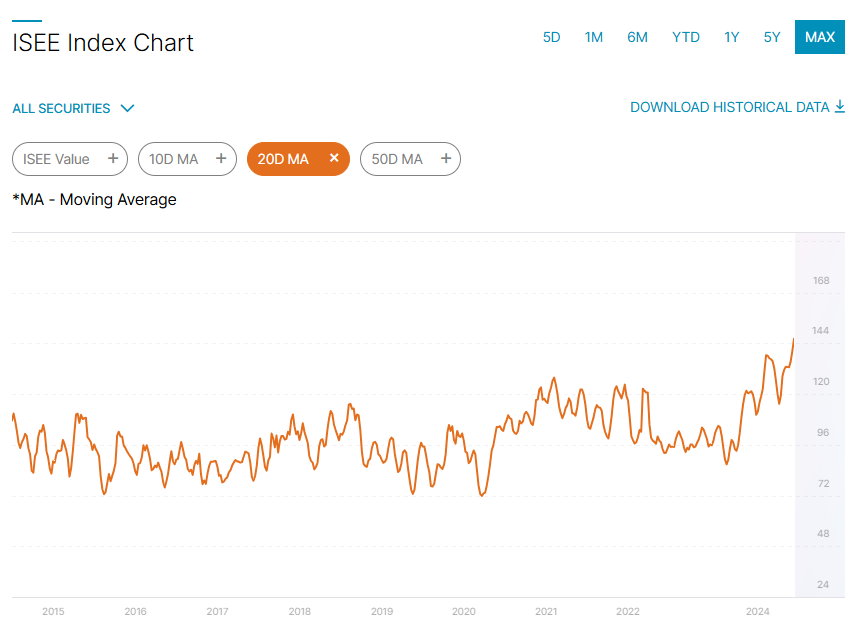
We're now near the end of a positive seasonal tailwind that lasts until July opex which is this Friday.  Considering the low put/call ratios and the rampant call option speculation over the past few weeks, I expect a big hangover as you get close to this monthly opex.  The ISEE index showing the call/put ratio of opening transactions reveals the stretched nature of the options activity.  The ISEE index 20 day MA is now the highest in its history, higher than even the go-go speculative days of 2021.  

I am seeing similarly high levels of opening transactions in calls vs puts in the OCC data that comes out weekly.  Options speculators are heavily betting on more upside, aggressively buying call options in the most liquid, high beta names.  Here is the call activity in IWM on Friday, the highest daily call volume ever for this ETF.  The net deltas and overall premiums paid for IWM call options were extreme. 


The overbought and overextended charts in SPX is a powder keg, waiting to trigger at the slightest hint of weakness.  The markets often trade in symmetry, so when prices go up rapidly, they are apt to fall rapidly.  Its been quite a steep uptrend over the past several days, and big picture, for most of 2024.  A couple of markets this reminds me of are July 1998 and January 2018.  Sharp blowoff tops that reversed even more quickly than they went up.

SPX July 1998

SPX January 2018
 

Over the weekend, after studying the Commitment of Traders data in more detail, it was an eye opener to see how long the asset managers have gotten in SPX futures, with the net long as a percent of open interest much higher than even the highest levels in 2021.  And those asset manager net long levels in 2021 were much higher than previous highs seen in early 2018.  Most of the increase in asset manager net long exposure has come from a huge decrease in the number of short positions.  SPY and QQQ short interest also keep going lower and lower.  The Street is very lightly hedged for downside at the present time.  I didn't think it was possible so quickly after the everything bubble in 2021, but in many ways, this current AI bubble is more frothy and dangerous for long term stock investors.  For sure, the positioning in SPX futures and SPY/QQQ ETFs is definitely more ominous than in 2021. 

COT SPX Asset Manager Short Position

SPY/QQQ Short Interest

A confluence of indicators are lining up to present a high risk/reward opportunity on the short side for SPX and NDX.  Technical, seasonal, and positional indicators are flashing amber lights here.  I am hearing many traders and investors who view July as a slam dunk up month, pointing to seasonality, and many of them are planning to sell at the end of the month.  I would not be surprised to see a sudden rush for the exits over the next 2 weeks as the uptrend tops out and post opex forces come into effect after a huge call buying spree over the past several weeks.  

Add to the mix the suddenly bullish news flow (Trump assassination attempt bumping up his election odds) and you have the ingredients for a good news topping process (cooler CPI, more Fed rate cuts priced in, Trump odds of winning going up, stronger breadth, etc.).  This it's "so bright, you have to wear shades" kind of news flow over the past week with the volatile price action catches my attention.  Based on pure instinct, I want to short more.  I plan on adding more SPX shorts early this week to get to a max short position.  I have not seen such a good risk/reward opportunity on the short side in SPX since late 2021. 

Tuesday, July 9, 2024

Giffen Goods

The higher the prices, the more demand there is for stocks.  Stocks have turned into Giffen goods.  In particular, the Mag 7 and the other momentum favorites like LLY and COST.  They are like luxury items.   The buyers don't care about valuations.  They just care about making money, and believe that the current uptrend will continue into the future.  That is momentum investing.  The passive investors just put there money into index ETFs, target date funds, etc. and let it ride. 

This momentum game can go on for a long time but not forever.  Eventually, even luxury items like Mag 7 stocks get too expensive, and marginal buying has less effect on the stock price, and eventually when the trend breaks, the sellers come out of the woodwork.  That is what happened at the January 2018 top, February 2020 top, the January 2022 top, and the next top which I would guess happens sometime between now and year end.  Its hard to time tops, but you can get a general idea of when both valuations and positioning are extreme, and those are signals that usually result in a top within a few months. 

Dealers have been building up bigger and bigger short positions in SPX futures, amassing a larger short position than late 2021, and comparable to January 2018 and February 2020.  Those previous 3 cases were in the vicinity of significant tops that resulted in a big correction within weeks (Jan 2018, Feb 2020) to a few months (2nd half 2021).  


Large short positions for dealers means that they are hedging their books which are heavily short out of the money puts and long calls (both in and out of the money).  When institutional investors are heavily long the market, their demand for out of the money put protection increases, as well as the supply of out of the money calls, as covered calls is a popular strategy these days.  So dealers end up heavily long out of the money calls and short out of the money puts.  They hedge this by shorting futures.  

Also, you are seeing asset managers with very large net long positions in SPX futures, which is a quick and easy way for them to add net long exposure, without having to worry about picking the right stocks.  The COT data for SPX and Nasdaq futures are both showing asset managers holding large net long positions and dealers holding large net short positions.  The positioning is extreme, and sets up a ticking time bomb scenario for the SPX and NDX.  History shows that you get violent corrections off of these setups. 

As has been the case since mid May, the stock market has been going up on the strength of a small group of large cap tech stocks + a few large cap momentum stocks like LLY, COST, CMG, etc.  The majority of the stock market has not been participating in the run up from SPX 5300 to almost 5600 over the past 50 days.  This not only goes for the US stock market.  Foreign stocks markets have badly lagged the performance of the US, and are mostly trading below their early April highs.  While the SPX is up 6% from those early April highs.  The Russell 2000 trades horribly, as their fundamentals are fairly weak, and investors are not willing to push up the prices of so many value traps.  This reminds me a lot of the 1999 market when tech stocks were flying higher, but almost everything else was going sideways or down.  Only in the last gasp blow off top in spring of 2000 did you see small cap stocks catch up and squeeze higher, but that rally fizzled out immediately into a sharp correction.  The parallels between the internet bubble in the late 90s and 2000 are eerily similar to the AI bubble that we are witnessing now.  All the way down to the weak breadth in the market outside of the stocks in the bubble halo. 

Without even looking at the economic data, just by looking at the way the Russell 2000 is underperforming the broader market,  you can sense that the economy is weakening.  I don't need to see lagged, butchered, and badly manipulated BLS data to confirm what I'm seeing in the market.  Yet investors remain complacent because 1) they believe that the Fed will engineer a soft landing by cutting rates later this year 2) they are making money in their index funds and have been conditioned to buy and hold no matter what.  The 30% drop in early 2020 and the 9 month bear market in 2022 have taught investors that bear markets and sharp market drops will be brief, and that the SPX always comes back stronger, making new all time highs within either a few months or a couple of years!  

Not only do US investors believe this, foreign investors have been paying attention and seeing how much the SPX has outperformed their country's stock index since 2008, and are now believers in US stock market exceptionalism.  Foreign investors are like the dentists of the past.  They are the last to get the buy memo, and are often caught chasing strong markets right as they are about to top out.  

The ingredients for a long bear market are here.  Positioning can get more extreme, but not much more extreme.  You probably need one last bullish, euphoric move higher based on "good news", such as Trump getting elected, with investors front running potential tax cuts and whatever other fiscal stimulus that comes along with a Republican sweep of Congress and the White House.  Considering how unpopular Biden is, and how unhappy the population is with high inflation and a stagnating economy, its almost a lock at this point that Republicans sweep.  That could be the final euphoric top for this bull market before reality sets in and investors realize that even bigger budget deficits just mean more inflation and higher longer term rates, rather than a return to strong economic growth.  

Got short on Friday, which was too early, and I'm saving my short bullets for a bit higher of a move before adding.  I need to see either a extreme blowoff move higher to add or some confirmation that the upward momentum is petering out and sellers are starting to come back.  Its a hard way to make money, shorting such a strong uptrend.  But that's how some traders and investors are wired.  Perhaps a rally on the CPI number on Thursday could be the exquisite moment to add to shorts. 

Tuesday, July 2, 2024

Bond Brakes

The bond market is putting the brakes on the stock market.  It was smooth sailing with the weaker economic data for the past 2 months but now that weakness has been priced in.  You started to hear more optimism on bonds and less optimism on the economy.  But that has run its course.  The economic expectations have been lowered, meaning that it will be easier for data to beat expectations, creating negative catalysts for bonds.  That has made Treasuries vulnerable to profit taking for any reason, even for something as far off as a higher probability of Trump getting elected.  

The knee jerk reaction from last week's debate was that Trump is more likely to win in November, meaning that you are more likely to get the Trump tax cuts extended, as well as having even more tax cuts on top of that.  That would blow out the budget deficit even more, and stimulate the economy creating more inflation.  Add to that the potential tariffs, as well as a tighter labor market coming from less immigration, and you have an inflationary mix that bond investors are revolting against.  

While I agree those policies are inflationary, I don't agree that Trump will get much done. He doesn't seem like a guy who is all that interested in policies, or passing a bunch of bills.  It was really the Democrats working with that closet Democrat Mnuchin, which resulted in that giant Covid money spew through the PPP program as well as assorted other handouts.  He's just a guy who enjoys being in the role of President, and the power that it entails, and using that power to enrich his cronies/family/himself in the process.  He seems obsessed with the stock market, so I don't think he'll try to fight the bond market because that is in essence fighting the stock market by trying to introduce super inflationary policies.  Overall, he probably doesn't get much done, and its basically the status quo, which is a stagflationary economy that is weakening slowly but unlikely to go into a deep recession due to bloated  fiscal policy.

What we saw the last few days isn't quite the return of the bond vigilantes, but with so much supply coming down the pike with the huge fiscal deficits, the bond rallies don't seem to be able to last for more than 2 months or so.  10 year yields have gone from 4.7% to 4.2% from late April to late June, so you've had your 2 month rally.  All those hard fought gains from bond investors over the past 2 months, gaining 50 bps, half of those gains have been lost over the past 4 trading days.  Hard come, easy go.  That is the definition of a weak market.  

You had some who were reluctant to be short Treasuries and Bunds due to the well telegraphed weak PCE number on Friday and the French parliamentary elections on Sunday.  Once that turned out to be a nothingburger, the risk off bid for Treasuries immediately disappeared.  Treasuries are not the risk off asset that they used to be.  The bids are fleeting, and you have to be extremely quick to take profits on the risk off rallies, because they just don't last for long.  Its the opposite of what you had from 2008 to 2020.  Those Treasury rallies lasted and lasted, and lingered near the highs, giving bond holders lots of time to sell the highs.  No longer.  The nature of the market has changed, with stock/bond correlations positive, making Treasuries a poor hedge for long equity exposure.  Instead of hedging risk, Treasuries have added risk during stock market selloffs since 2021.  

This has long term implications for financial assets and portfolios.  Investors will have to take less risk on the equity side and the fixed income side due to these correlations.  Long term, I find it hard to imagine a world where you have multi trillion dollar deficits during an economic expansion while maintaining low bond yields, high equity prices, and a strong dollar.  If the Fed wants to keep asset prices high, it will have to keep yields artificially low by either having negative real interest rates on the short end, or by restarting QE and pushing long term yields artificially lower.  The dollar will be the release valve in this situation, and will weaken substantially, which will help to contribute to higher inflation through more expensive imports and more bank lending which increases the money supply.  

Once you blow out the fiscal deficit to high single digits % of GDP, the free lunches go away.  Fiscal stimulus results in limited to no real growth, with most if not all of the nominal growth coming from inflation.  When you have inflationary policies and are unwilling to control the deficit, the population eventually picks up on the game, and act accordingly.  Sellers raise prices more quickly, and in bigger chunks.  Buyers will begin to hoard or try to get rid of paper dollars as quickly as possible if these inflationary policies continue.  Dollars will eventually become hot potatoes, like Argentine pesos are now.  We are not yet in the hoarding/immediately convert paper to hard money stage, which is Argentina type stuff, but its not too far away with this deficit trajectory.  The politicians are of course asleep at the wheel, continuing to pander and do whatever it takes to get re-elected, which is to give out goodies/cut taxes.  The exorbitant privilege of having the reserve currency let's the US get away with these policies for longer than any other country in the world, but foreigners will eventually revolt by selling dollars.  

Will voters start caring about the budget deficit and demand more fiscal discipline?  Only if they feel pain from the high budget deficits.  You need to see sustained, high inflation, double digit inflation year after year, and higher bond yields resulting in higher mortgage, credit card, and auto loan rates.  You saw a preview of that in 2021 and 2022, but it still hasn't gotten through to the thick heads of the American public, who still want their tax cuts, student loan cancellations, Social Security and Medicare benefits, and whatever other stimmies the politicians throw at them.  No one wants to experience short term pain anymore, so they will have to accept higher inflation as a result.  And it still seems many out there can't seem to put 2 and 2 together, and still blame supply chains for the higher inflation, instead of all the money printing that happened. 

Back to the current markets.  I am sensing weakness in NVDA vs the rest of the tech sector, as it seems the AI bubble got a bit ahead of itself in June.  You are still seeing Russell weakness vs the SPX and NDX.  Its still the same crap market underneath the shiny veneer of a low volatility, safe looking broader market.  That hasn't changed.  What has changed over the past few days is the bond market uptrend coming to a violent end, taking the SPX and Russell 2000 down with it.  That makes me even more bearish than I was previously, but am waiting for any short term rally to put on shorts.  Perhaps July 4th holiday bullishness will ignited a little rally to sell into.  An SPX rally towards 5500 to 5520 would be a gift to short.  Hoping for that rally within the next few days, perhaps on weaker nonfarm payrolls or a cooler CPI next week.  This market looks very vulnerable here.  Its just a matter of getting a good short entry. 

Tuesday, June 25, 2024

The Hamptons Spread

The stock holders seem to be on vacation, with hardly a worry, as their portfolios keep increasing in value, with little urgency to sell.  It appears to be a Alfred E Neuman offshoot of the O'Hare Spread.  Instead of going all in on futures and flying to O'Hare to get out of the country, just in case you lose it all plus more, its going all in on US megacap tech stocks and going to the Hamptons, without a worry in the world, looking to spend your stock market gains before they happen.  With the confidence that megacap tech stocks will keep going higher, those buying the Hamptons Spread go ahead and plan their vacation looking to spend their growing wealth from their large cap, tech heavy portfolios. 

There is little excitement about the overall market.  I don't see the enthusiasm for the SPX.  There is complacency, but very little enthusiasm outside of a few big cap tech stocks that are riding the AI gravy train.   So with so little excitement, how can this market just keep going higher and higher, with just tiny pullbacks, with seemingly more upside vol than downside vol.  The moves higher are quick and fast, while the moves down seem slow and labored.  The strength is uncanny.  Its hard to explain, other than those holding big cap stocks and index funds are just not very eager to sell.  Its not a lot of buyers that are moving stocks higher, it is the dearth of sellers (in the Hamptons?  on yachts cruising to Europe?) that allow for this steady move higher with minimal resistance.

Historical patterns just aren't holding anymore.  In the past, when the Russell 2000 lagged the SPX so badly, usually a pullback in the SPX was just around the corner.  Not anymore.  The Russell 2000 weakness vs SPX didn't signal anything in 2023, as the SPX just kept going higher and higher despite the Russell lagging all the way.  Same thing is happening in 2024.  The Russell 2000 is no longer providing that leading signal for the SPX, as its just trading in its own little world, often times opposite of the SPX.  Its almost as if some pod shops had on a huge pair trade long Nasdaq 100 and short Russell 2000.  Maybe that is what explains the bid in Russell 2000 on Monday despite the Nasdaq 100 weakening.  

I didn't have a great feeling about the SPX short position last week when I saw so many mentions of the bad breadth and narrow leadership of the market, implying that the market was due for a pullback.  It is never a good feeling to have your thoughts repeated by those on CNBC.  I'd rather be on the other side of their trades than have them join my side.  But I still can't ignore the risk off signals from the poor performance of economically sensitive stocks, poor breadth overall, as well as weakness in risky assets like bitcoin.  They have been leading indicators of future SPX weakness in the past.  Maybe there is just so much government money sloshing around that the rich don't feel a need to sell stocks to continue their conspicuous consumption.  But I'm not willing to make that bet.  As much as this market is frustrating the bad breadth bears, the SPX is so overextended and overvalued, that the better risk reward is the short side from mid July to early October. 

Of particular note on Monday was the sharp drop in NVDA, even though the Nasdaq 100 and SPX were only down a few bps.  With hindsight it looks clear now that we got the blowoff top in NVDA last Thursday, as the uptrend was just too steep, the optimism and hype just too thick, for the move to sustain for much longer.  It is an important marker for the AI trade, as you saw a lot of big reversals in AI related names like AVGO, TSM, MU, ARM, and DELL.  This is either the final top of the AI bubble, or first of a double top topping pattern in all likelihood.  That double top could have a slightly higher high for the 2nd top, but no big breakout from the highs made last week.  Looking back at past momentum bubbles, we probably get some consolidation at this new higher range, with one final last gasp rally sometime near the end of the year.  After that, you likely see a brutal bear market for all the AI plays in 2025.  

It still feels a bit early to put on a longer term short, as the selloffs have been minor and the bond market has been strengthening lately.  10 year yields are around 4.25%, down from 4.70% in April.  Its enough of a rally to keep stocks from falling too much from here.  If you get some renewed weakness in the bond market and more optimism about the economy in the coming weeks, that would be a better spot to go short.  

The COT data showing futures positioning came out yesterday, and it looks like asset managers didn't add longs into the 2% SPX rally from Jun 11 to Jun 18.  Asset managers positions hardly moved.  It appears this rally is not being met with a lot of new buying.  It looks to be a mix of short covering, dealers delta hedging options on the way up, and corporations buying back stock, just before the stock buyback blackout period starts near the end of the month.  

I was expecting more weakness into the post triple witching opex time period.  While we are pulling back, I was looking for more, considering how much the SPX went up the last 2 weeks, and how weak the AI names have been.  With the post opex weakness window shortened by the upcoming end of quarter, I got out of most of my shorts yesterday and will cover the remaining shorts today.  The short play was disappointing, but we are entering a seasonally strong period of the calendar surrounding the end of June and early July, which for some reason (summer complacency, lack of eager sellers during the summer holidays) are usually a strong period for the equity market.  I will not fight that seasonality and will be on the sidelines waiting for a better spot to put on shorts.  Its tough fighting such a strong momentum market, so one has to be picky choosing when to enter shorts and look for a reversal.  However, a reversal does feel like its due within the next 1-2 months, given all the secondary signals showing weakness as mentioned in previous blog posts.  I won't be staying on the sidelines for long, perhaps coming back to the short side in the middle of July.  

Tuesday, June 18, 2024

Bubbling Up Into a Slowdown

Most bubbles occur in an environment of economic optimism with strong global growth, rising commodity prices, and rising bond yields.  That is what happened in 1999/2000, in 2007 (not a stock bubble, but a housing/credit bubble), and 2021.  This is unlike any of those bubbles.  This economy is slowing down, as shown by both the economic data and real world price signals such as commodities.  Here is a list of some industrial/housing commodities which are showing weakness in the face of this SPX/NDX bubble.  


We are seeing a huge disconnect between tech stocks and the rest.  Institutional investors are fleeing stocks showing weakening growth trends and crowding into the few remaining favored growth names, which are blessed with the AI halo effect.  In the internet bubble in the late 1990s/2000, you had strong economic growth worldwide.  In this AI fueled bubble, you have economic growth that is inflated by under reported inflation and US fiscal largesse.  Yet even the butchered government data is showing a slowdown. In addition to the economic data, which are lagging and often heavily revised, you can just look at the performance of the majority of US stocks to see proof that the economy is slowing.  

The equal weight S&P 500 ETF, RSP, is lagging SPY badly in the past few weeks.  


While breadth is an overrated short-term indicator, over the long term, weakening breadth in a very overvalued stock market is a reliable sell signal.  It warned of impending bear markets/corrections in summer/fall of 2000, fall of 2018, and fall of 2021.  

While the fundamentals are getting more bearish as prices go higher, you have to respect the upward momentum which attract more funds into the SPX and NDX complex.  Foreign holdings of US financial assets in equities is at an all time high, rivaling those levels last seen in late 2021, and slightly higher than the peak in 2000.  Foreigners are usually late coming into a trend and notorious for chasing hot assets and dumping them when they lose favor.  


The warning signs are piling up.  It is happening at a time when valuations of US stocks, in particular, large cap tech stocks, is in nosebleed territory.  While these large cap tech stocks have great asset light businesses with fat profit margins, they will have problems maintaining growth as most of their businesses (aside from AI) are becoming mature with slowing growth rates and running into the law of large numbers.  AAPL is already showing basically no revenue growth, as the smart phone market is now saturated and no longer a growth business.  Same goes for internet advertising, which is dominated by GOOG, META, and even AMZN.  Future sources of earnings growth for these tech giants will have to come from cutting expenses (reducing head count), which is a net negative for the economy. 

There is still 6 months left in the year, and momentum bubble markets like this usually don't make major tops in the summer.  The Nifty Fifty bubble topped out in January 1973.  The Nikkei bubble topped out in late December 1989.  The dotcom bubble topped in March 2000.  The everything bubble topped out in early January 2022.  With an election coming in November, and with recent memory of big post election rallies in 2016 and 2020, its likely that you will see investors chase US stocks higher into year end.  Odds favor a top happening either in late December or early January.  That doesn't mean that you won't see pullbacks along the way, and you cannot rule out this market bucking past stock market history and topping out in the summer.  

Remain short and added more into the rally yesterday.  Still playing for a pullback for the remainder of June.  Considering the strength shown recently, the pullback is probably going to be weaker than originally expected. 

Wednesday, June 12, 2024

Late Stage of the AI Bubble

The internet is to AI what the airplane is to auto pilot.  Yet here we are, with investors comparing the current AI bubble with the internet bubble of the late 90s/2000.  The use cases for the internet were enormous.  The practical use cases for AI are limited and more specialized.  The internet actually saves energy, while AI consumes huge amounts of energy.  As the years go by, technological innovation continues, but the productivity gains get smaller and smaller.  Mankind have mostly picked the low hanging fruit when it comes to productivity gains through technology.  The internet was a huge productivity booster.  AI will be much less so, and at much higher costs due to the high energy use for unreliable, flawed results.  

While this AI bubble is much smaller than the internet bubble, it is more ridiculous because none of these big tech companies spending multi billions on AI have a clue on how to profitably monetize the technology.  Considering how much they have to pay to NVDA for the chips and the high maintenance costs, it requires a lot of revenue to cover the expenses.  We are still in the grace period where spending willy nilly on AI is still rewarded and even encouraged by the stock market, but that won't last forever.  Look at what happened with Facebook stock when they spent all those billions on the metaverse.  It got crushed and only recovered when Zuckerberg gave up on his dreams.  I see a similar situation where the stock market will start expecting results from all the AI spending, and will start punishing companies that keeping pouring money into the AI fire pit.  This is a controversial statement, but AI is closer to the metaverse bubble than the internet bubble.

Since the AI bubble began in 2021, first as a small niche and now as a burgeoning sector of the stock market, the hype, mentions, buzz, and excitement about AI is as intense as ever.  It is getting irrational out there.  NVDA exploding higher was the main catalyst, but its spawned "satellite" AI plays in semiconductors like TSM, AVGO, etc., in hardware like DELL and HP, utility companies that would benefit from greater electricity demand, and now, end users like AAPL, which ended up being a buy the rumor, buy the news reaction on their AI plans at the WWDC conference.  That is how big this AI bubble is becoming.  Even with AAPL just using OpenAI and not getting paid for any of the extra AI features, its getting a big boost and up 25% in less than 2 months.  The chase for anything AI related, based on extremely optimistic projections has infiltrated the stock market, and gotten retail investors buying into the hype.  Like all bubbles, retail investors are the last to get the memo and buy the most right before the bubble pops, add on the way down, and ride it all the way to the bottom.  

It is uncommon for such a bubble to happen so soon after a previous bubble, the Everything Bubble of 2020/2021, burst just 2 and 1/2 years earlier.  But investors have short memories, and the FOMO mentality is pervasive among retail investors as well as institutional investors.  The US stock market, in the form of SPX and NDX, are the gift that keep giving, which reinforces the uptrend.  It is fascinating to see investors so confident even as bond yields stay higher than most expected.  Here is a look at the household percentage of financial assets held in equities as of end of March.  This number is higher now as the S&P 500 is up another 2% since then.  


These are nosebleed levels for equity allocation among households.  Even during the dotcom bubble in 2000, the equity allocation wasn't this high.  Its slightly higher than those crazy times in 2021 when it seemed everything went up huge with investors all in on stocks.  This high of a level of equity ownership among households magnifies the wealth effect of stocks.  Don't be surprised to see consumer spending vacillate with the ups and downs of the SPX in the coming years.  The US economy is now heavily financialized, making the stock market the most powerful leading indicator of the US economy.  

As you can see from the above chart, when equities held as a percentage of financial assets gets high, a bear market is just around the corner.  

We have the CPI report and FOMC meeting today.  There seems to be quite a bit of complacency going into these events.  Based on what I hear on CNBC and Bloomberg, most are expecting a dovish Powell and a rally after the FOMC meeting.  Since the Powell dovish pivot in October 2023, the market has rallied at almost every FOMC meeting, as Powell has talked dovish at each one.  Will he repeat his dovish performance again?  I wouldn't be surprised if he did, as he seems more worried about his reappointment by the next President than he is about appropriate monetary policy.  

There continues to be breadth divergences as we got another Hindenburg Omen in the Nasdaq and more signs of a split market where a select group of tech stocks keep going higher, while a majority of stocks are unable to rally and keep up with the SPX and NDX.  Global risk appetite appears to be abating as Europe and Asia trade much weaker than the US.  Bitcoin, gold, and silver are starting to falter.   The leadership is getting narrower, and other periods where SPX kept making new highs with so many laggards led to a sudden pullback, e.g September 2014, July/August 2015, October 2018, April/May 2019, July/August 2019, and November/December 2021.  The only time within the past 10 years where the market ignored these divergences and kept going higher was in 2017.  That cannot be ruled out, but 2017 had much lower valuations than now and investors had much lower equity allocations, leaving them with much more room to add equities.  

Remaining short SPX and holding.  Looking for a 4-5% pullback from current levels to reset the bullishness and consolidate the big gains so far this year. 

Wednesday, June 5, 2024

Warning Siren

The warning siren is getting louder.  Since last week, we're seeing more signs of weakness underneath the indices, masked by the strength of big cap tech stocks.  You are seeing more volatility in individual stocks but they are not showing up in day to day SPX volatility.  But we are seeing a pickup in intraday SPX volatility, which is interesting.  Last Friday, May 31, you had quite a bit of intraday volatility that is unusual when the VIX is so low, and when the market is less than +/- 1% on the day.  You had an 89 point day range in the SPX and the VIX closed at 12.92.  

On Monday, after another big intraday drop with another big closing rally, investors finally started to notice that the cyclical stocks were weak, especially industrial and energy names.  On CNBC and Bloomberg, macro views are shifting from a strong economy with worries about inflation, to now worries about economic slowdown with weaker ISM and PMI data with oil leading the way lower.  You can see the asset flows shift from equities to bonds as lower yields haven't really helped stocks rally, which is a break from the pattern of lower yields, higher stocks.  In particular, for the past year, whenever yields went lower, Russell 2000 would outperform SPX.  But the RUT is actually underperforming SPX even as bonds rally.  That speaks to how weak the small cap stocks are in this environment.  

The IWM:SPY ratio made a new YTD low even though 10 year yields are more than 30 bps lower than the highs set last month.  And you are still seeing the rampant speculation in meme stocks, like GME on Monday gapping up huge on a pump by Roaring Kitty, a blatant pumper.  You are still getting low float daytrader stocks going up 300% in a day on spurious or no news.  This is about as unhealthy of a market that you can see that is less than 1% from all time highs.  

Last week's COT data shows asset managers back towards their highs in net long position in SPX futures.  Asset managers are now fully loaded and have very little room to add more to their already heavy long positions.  Remember, asset managers usually chase strength and sell weakness.  So they are potential sellers if we get a pullback.  Dealers have gotten even shorter, and their net short position is almost the biggest for the past 12 months. 


Pontificating on the macro situation is interesting but usually there is no alpha there.  But it appears that the strong stock market rally from the October lows to the April highs had a stimulative effect on the economy, and with the uptrend flattening out and getting choppy, that SPX rally "stimulus" is fading.  I know that it is en vogue to talk about the huge fiscal deficit and how much that is stimulating the US economy, but it seems very few talk about the wealth effect of a rising stock market boosting consumption and investment.  

The financialization of the US economy is now so deep and firmly rooted that its the tail wagging the dog.  The tail, the S&P 500, is wagging the dog, the US economy.  The dynamism has been sucked out of the US economy as the government has taken a bigger share of the borrowing and spending, making the private sector less influential.  That is what happens when you have low population growth, minimal productivity growth, and aging demographics with a stagnant labor pool.  The cyclical ups and downs are smaller, as the government can print money and borrow anytime they want to.  And politicians are willing to push the deficits higher and higher as they chase populist goals and feed more stimulus to an addicted population.  In the long run, this keeps the recessions at bay, or very mild if they do happen, but also keep inflation elevated.  

We have a big gap up as the market anticipates more bullish news in the form of an ECB rate cut tomorrow, a weaker than expected NFP that should rally bonds and stocks, as well as the WWDC conference next week where AAPL will introduce whatever AI hype machine that they can come up with.  Also don't forget the NVDA split happening on Friday, which is widely anticipated by the tech bulls and next week's CPI and FOMC which bulls will believe to be further bullish catalysts. 

I have initiated a short position in SPX and will add more later today and tomorrow.  This is a swing trade looking for a down move to happen for the next month.  You probably need to get past the CPI and FOMC before you get a real big move lower, but this market has been teetering and it could selloff sooner than even I expect, which explains the short entry this week. 

Thursday, May 30, 2024

Second Warning Shot

This market is wobbling.  AI is the only game in town.   NVDA is holding up the Nasdaq.  There is a growing number of individual names showing weakness underneath the surface of calm in the S&P 500 and Nasdaq.  This triggered a Hindenburg Omen signal for the Nasdaq on May 23.  

The last 2 signals were triggered on March 12 and 13, so it was early in forecasting a correction then.  It also triggered 6 times from mid January to early February without any negative consequences.  A cluster of these signals are more meaningful, but even one signal is a negative for the intermediate term.  A cluster of Hindenburg Omen signals  preceded corrections by firing off on November 2021, February 2020, July/August 2019, August/September 2018, and July 2015.  In the past 10 years, it provided false signals in December 2014, June 2017, August 2017, and November 2017.  The hit rate is about 60% for predicting a correction within a month, which is actually a strong bearish signal because any random 1 month period in the S&P 500 historically has gone down less than 40% of the time.  

The COT futures positioning data also supports the bear case for an imminent pullback.  As expected, asset managers chased the market as it went higher and net longs in SPX futures are back to late March levels.  Dealers also added to shorts, taking net shorts down to late March/April levels.  Positioning is now saturated, making the market vulnerable again. 

Speculation is rampant again among small cap daytrader favorites.  Two weeks ago it was the meme stocks.  Last week was NVDA and various small cap stocks that spiked out of long term downtrends amidst intense daytrader speculation.  This week has been tertiary AI names that have rallied.  This kind of activity in small cap stocks happen when optimism is high and positioning is quite long already.  This is not a perfect indicator and is usually early, but its another sign that bulls have gotten too aggressive taking the market higher and a pullback is likely within the next month.  

NVDA has been catching my attention since its earnings report came out.  It has gone up 20% in the past 4 trading days, taking its market cap to nosebleed levels.  NVDA's market cap is now almost the same as AAPL, and only 10% less than the biggest of them all MSFT.  Its market cap is $700B larger than GOOG.  $1000B larger than AMZN.  From a 30,000 foot view on NVDA's long term return prospects versus AAPL, MSFT, GOOG, and AMZN. I would take all 4 over NVDA all day long.  NVDA is being valued as if this AI capex build out will go on in perpetuity.  There is so much hype surrounding AI, while the use cases are so much more limited than the amount of enthusiasm about the technology.  I am looking into putting on a long term short position in NVDA within the next 3 months.  You could get one last bubble spurt higher post-split, as the lower stock price will trick investors to think its less expensive. 

On the macro front, bonds trade horribly both in the US and Europe.  The slightly lower than expected CPI number happened to be the top for both Treasuries and Bunds.  Since then, its been a downhill slide for bonds, despite almost no economic data of consequence.  Treasury auctions have tailed badly and demand is not strong enough for the huge supply deluge.  And this is during the seasonally strong mid to late May time period post refunding auctions for 10 and 30 year Treasuries.   This is not a good sign for June, especially if Powell finally stops trying to force his dovish bias onto the market and accepts that the market wants to price yields higher given sticky inflation, the strength of the stock market, and tight credit spreads.  This bond market weakness is likely to persist into the election, as bond investors will not want to get too long ahead of what has been bad news for bond investors in the past 2 Presidential elections (selloffs after 2016 and 2020 elections) with 2 deficit loving Presidents.

We have price action in individual stocks giving a bearish signal (Hindenburg Omen), we have positioning back to near max long in SPX futures, and lastly, we have the complacency, lack of fear, and rampant greed among individual investors as meme stocks and AI stocks like NVDA have gone crazy.  This is lining up for a high risk/reward short going into June.  The only fly in the ointment that I see is that CTAs that I track are still not long SPX, based on correlations with daily hedge fund CTA return data and positions in the most popular trend following CTA ETF, DBMF.  If they did start getting longer, that would be the final piece that would line up for a super bearish setup.  As it is, its still a bearish setup but I don't like to short in the hole when the SPX is in such a strong uptrend.  I am not seeing much euphoria or enthusiasm about the SPX so that gives me pause about shorting into this market right away.  The next rally that takes it towards last week's highs would probably be a good short opportunity, but we'll need to see how the indicators and investors react to it.

Friday, May 24, 2024

First Warning Shot

Yesterday was the first warning shot from the bears since the post CPI relief rally on May 15.  This takes on more significance with the rally off the geopolitics/higher rates fear bottom on April 19 is now 5 weeks old.  That April bottom wasn't really capitulative, so it didn't provide enough of  reset to fuel this market higher for 5 months like the August-October selloff, which was exhausting and purged a lot of positioning.  So run of the mill dips like April's fuel up moves for a few weeks, and then enter a window of vulnerability where sudden dips and corrections occur.  

Until yesterday, there wasn't much to say, as the market was flat as a pancake and VIX was in the 11s.  The VIX is still quite low here in the 12s, but part of that is the lack of important econ. data in the next week and the long weekend coming up.  When the market is flatlining and doing nothing, like it did from May 16-22, there is no edge.  There is no signal to trade off of.  When you get the next movement off of this quiet period, which was to the downside, is where you get the signal.  

Thursday's selloff coincided with the post NVDA earnings blowout euphoria which took ES up towards 5368, or almost SPX 5350, and the bond selloff triggered by higher than expected S&P Flash PMI numbers.  That tells you something about the weakness in bonds when third tier econ. data can take bonds down so easily.  Notably, you saw NVDA strength unable to lift tech stocks, even semiconductor names.  A sign of buyer exhaustion.  That being said, usually the first small dip is bought and the highs are retested.  I expect this dip to be bought and another run towards the SPX 5350 area where I expect sellers to come out once again.  

COT Futures positioning data showed that asset managers have aggressively re-added to their net long SPX position, almost back to the highs set earlier in the year.  Dealers remain heavily short, a long term bearish signal.  This data is as of Tuesday, 5/14, so doesn't include the CPI rally where I am sure asset managers added to their longs.  That puts us back to saturated positioning among asset managers, which means most of the fuel for this rally has been used up. 

The complacency is evident in how cheap options have gotten, with the VIX back to levels last seen in 2019.  Volatility is just too low for how high this market is, but it just shows you the short term nature of this market.  As well as the popularity of selling options for income, which have sprouted more option selling income ETFs.  This is the kind of thing you see when there is little fear of a big selloff, and when investors feel confident and comfortable.  Not a great sign for long term returns when you see this kind of investor behavior at historically nosebleed equity valuations.  

On the sidelines waiting to put on shorts into the next rally, as I see good risk/reward for index shorts as well as individual names for the next few weeks.  The bond market is weak, so it is a no touch at this moment.  Shorting SPX is a superior trade to being long Treasuries for a risk off scenario.  That is quite the sea change from the 2009 to 2020 era where long Treasuries was almost always the superior trade to being short SPX.  But this is a totally different regime to back then, so adjustments need to be made. 

Thursday, May 16, 2024

Releasing the Tension

The move you saw off that CPI number which was just slightly cooler than expectations was a sigh of relief rally.  So much tension was built up over the 1st quarter regarding inflation that CPI became the most feared event on the calendar.  

Yesterday, you got the most feared economic data point released and that caused a buying stampede in stocks and bonds.  The biggest wall of worry has been inflation, and the CPI report has taken on renewed importance in the past few months.  Whenever investors focus on an event like this, you get distortions in price action and before and after effects which are more predictable than your random non event day.  As much as they say that algo trading and systematic strategies have taken over a big portion of trading, its still humans who pull the strings.  What you saw yesterday was a release of tension that comes from putting a feared event in the rear view mirror.  With that release of tension, investors became more eager to buy stocks and bonds even though yesterday's CPI won't really change Powell's reaction function.  But just not having something bad happen, which many feared, especially after the higher than expected PPI number on Tuesday, was enough to rocket this market higher.  That release of tension and reduced uncertainty usually leads to higher prices.  And that's exactly what happened yesterday. 

Sure, there are still your inflationistas who fear that inflation will remain sticky and that the Fed will not get that beautiful soft landing that so many are forecasting.  But even the inflationistas will admit that inflation is bad for bonds, not necessarily bad for stocks.  All you have to see is the performance of TLT vs. SPY over the past 18 months.  While yields have been going higher, so has the SPX.  

These days, you see very few who fear a hard landing/recession.  Even with the softer economic data lately (hard data, not soft data this time), most are looking at forward looking indicators (mainly financial conditions aka stock prices/credit spreads) which point to no signs of a recession anytime soon.  It is a consensus view, but its also likely the correct view for the next few weeks.  So you can't fight it, even at these lofty valuations.  

But let's not forget that even hard landings and recessions have a period of time before things get really bad where a slowdown is viewed as a soft landing.  You saw that in the fall of 2000, and in late 2007. 

With new all time highs comes opportunity, as the higher the SPX goes, the more potential energy builds for a sharp correction.  April proved to be the dip that refreshes, clearing out weak hands like CTAs and trend traders.  You also got enough of a purge in long positioning among asset managers in SPX futures to enable this market to go higher with fewer weak hands.  Asset managers have started to rebuild their net long positioning as of last Tuesday, May 7th.  It probably takes at least another 2 weeks for the latecomers to come on board, and then it will time to look for downside plays.  Over the rest of the month, we are likely in that low volatility grind higher/flattening out part of the rally.  The coming reduced volatility will likely lull investors into complacency again and then we can have another dip.  Right now, just on the sidelines waiting for the market to develop for a potential short play. 

Wednesday, May 8, 2024

Rock and a Hard Place

We are between a rock and a hard place.  There are sweet spots in the charts where you have good risk reward for a swing trade, for example after a flush out move lower in a strong uptrend (April monthly opex day), or the first retrace lower on bad economic data/earnings (after META disappointing earnings and higher than expected PCE inflation in GDP report) after the initial jump higher.  Right now, most of the bull fuel feeding off of the strong oversold levels have been used up. 

Over the past few days, the market has thrown some curveballs.  First, which was a surprise for most, including me, was Powell doubling down on his dovish rhetoric, believing that disinflation will continue and allow him to cut rates later this year.  He was way too early in celebrating the disinflation in late 2023 by forecasting rate cuts for 2024, and he's not backing off.  People are driven by incentives, and his incentive is to stay in power as Fed chairman, and that means keeping Trump out of the White House.  He won't admit as much, but Powell knows he's going to be fired at the first opportunity by Trump if he's elected.  If its Biden, he probably gets renominated as Fed chair.  So Powell is incentivized to help Biden as much as possible leading up to the election in 2024.  That means keeping the economy as strong as possible, ignoring high inflation as much as possible without losing his credibility.  

I thought Powell was going to cave in to public pressure to be more hawkish and sound tougher on inflation, but his hunger to remain in power has overwhelmed any kind of public backlash on inflation.  The dovish Fed was initially met with a strong rally, but sold off the same day, but then recovered quicker than I expected with the weaker than expected nonfarm payrolls which helped to put a big bid in to bonds, which reflexively kicked off a strong rally in equities.  This violent chop was definitely not expected, but it also shows how nervous the market was.  Despite the nerves, the lasting selling pressure just wasn't there, as most of the eager sellers had already sold.

On the macro front, it appears that traders are backing off the no landing scenario after the latest pullback in stocks and the weaker than expected nonfarm payrolls, PMIs, and ISM report.  But with bonds going up, they are now back to the soft landing scenario and believing that the Fed will have this market's back if there even a slight sign of labor market weakness or disinflation.   So back to optimism again on macro matters.

That is being reflected with SPX almost back to 5200, levels where upside is limited.  But downside also looks limited, with the market showing more strength than I expected.  The last COT futures report showed asset managers and small speculators reducing longs as of April 30, before that dovish Fed meeting.  Asset manager net long position in SPX futures is now back to levels of July-September 2023, when the SPX was trading around 4500.  Dealers also covered some shorts, but they still have a large net short position.  Historically, whenever dealers had such large short positions, a big correction was due within 6 months. 


A lot of the speculative froth has been wrung out of this market in April, which makes it dangerous to short in the near term.  But I just don't think the market is bullish enough or the fundamentals good enough to chase longs after such a big bounce off the April 19 low at 4967.  

This leaves traders between a rock and a hard place, with no easy trades.  Don't want to force anything here, there are no good risk reward opportunities in the SPX or in bonds.  For individual stocks, the opportunities are a little bit better but also mediocre.  Haven't been reading the market well for the past few months so the market will have to induce to me to put on positions by getting to prices where I want to buy or sell.  Right here, I don't want to do anything. 

Wednesday, May 1, 2024

Dusting Off the Hawk Costume

Powell celebrated too early.  At the Decemember 2023 FOMC meeting, he spiked the football at the 10 yard line, before getting to the end zone.  Bonds and the yen are taking the brunt of the pain this year for that premature celebration.  Powell is a politician, and he flows with the crowd, and the crowd is worried about sticky inflation.  After 3 straight higher than consensus CPI reports, he cannot come out sanguine and dovish at this FOMC meeting.  Even if he wants to be dovish, he just can't do that again.  He would look completely out of touch with reality if he did it.  So expect Powell to dust off the hawk costume from 2022 and try to reestablish some inflation fighting credibility.  You already heard him at his last speech getting rid of his rate cuts forward guidance for this year.  He'll likely go even further into hawk mode at this meeting.  

The bond market and the currency market (especially the Japanese yen) have already caught on and expect the Fed to stay higher for longer.  Its basically the consensus view at this point, which means its going to take a lot more hot inflation data to selloff the bond market further.  The odds are now skewing more in favor of betting on rate cuts again, as the Fed is still looking to cut as soon as the data cooperates.  And with consensus CPI expectations going higher, it will make it more likely that the CPI actually comes in cooler than expectations.  The CPI is such a manipulated and manufactured number that hedonic pricing influences will always keep the number lower than it should be.  Add to that the seasonal effects that gave hotter CPI numbers for the 1st quarter.  You are likely to have the opposite effect in the next few months, pushing the numbers lower than it should be.  Plus the owners equivalent rent calculation is so lagged that it still hasn't priced in the lower rent inflation of 2023.  That should flow into lower housing inflation numbers in coming months. 

From a big picture perspective, my views are still the same.  High valuations and excessive economic optimism (most believe either in a soft landing or no landing, see below). 


Futures positioning is also unfavorable for the next several months, as you have commercials go net short ES over 200K contracts over the past few weeks.  Commercial net positioning of -200K or more has been seen near tops in January 2018, October 2018, and late 2021.  Also, small speculators have been building up long positions throughout this year, which is also bearish long term.  It isn't great for short term market timing, but its a good indicator for showing that the market is vulnerable to a big down move within a few months. 

ES Commercial Net Position


ES Small Speculator Net Position

10 year yields at 4.68% is getting close to a decent short term buying opportunity, although I would wait for the FOMC hammer before buying Treasuries.  Perhaps 10 year yields of 4.80%-4.90% would be place to put in bids for a return to a move towards 4.40%-4.50%.  If we do get the Powell hawkish hammer that I am expecting, that should also push SPX down towards 4900-4950, breaking the previous lows from monthly April opex at 4953.  That could be the final flush out of this move, which would coincide with how many of these extended selloffs usually last, which is ~ 1 month.  This selloff from the all time high started on April 2, so we are closing in on 1 month.  

I sold the rest of my SPX longs yesterday.  Now looking to buy dips on SPX and Treasuries after FOMC.  If the SPX can get to that 4900-4950 zone, the plan is to get long and hold for a intermediate term move higher that could last 4-5 weeks.